With national TB statistics there will generally be two main types of TB statistics. There will be reports of actual cases, which is the minimum number of people affected, but these TB statistics are of limited use if many cases go unreported. There are also estimates, which are based on surveys, and they are often used to give the proportion of people living with TB. There will always be various assumptions made in compiling estimates, which is why they can sometimes provide very different figures from the TB statistics based on reported cases.
TB statistics and indeed the statistics for other diseases, will often refer to the incidence and prevalence of a disease. The TB incidence is the number of new cases of active TB disease in a population during a certain time period (usually a year). The cases of TB page gives the estimated incidence of almost every country in the world. The TB prevalence is the number of people in the population who are living with active TB. Prevalence is usually, but not always given as a percentage of the population.1“Basic Statistics: About Incidence, Prevalence, Morbidity, and Mortality - Statistics Teaching Tools”, Department of Health, New York State www.health.ny.gov/diseases/chronic/basicstat.htm
In 2015 an estimated 1.4 million people who were HIV negative died of TB.
In addition there were 0.4 million deaths resulting from TB disease among people who were HIV positive. So there were a total of 1.8 million TB related deaths. TB is one of the top 10 causes of death worldwide. People who have both TB and HIV when they die, are internationally classified as having died from HIV. There is more about TB & HIV co-infection.
In 2015 there were a total of 1.1 million HIV related deaths.2“Fact Sheet - Latest Statistics on the Status of the AIDS Epidemic”,UNAIDS, www.unaids.org/en/resources/fact-sheet
The 1.1 million HIV related deaths compares with 1.4 million people dying from TB. So TB now annually causes more deaths worldwide than HIV.
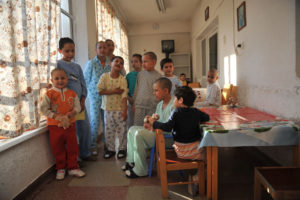
The global TB statistics show that in 2015 an estimated 170,000 children died of TB ©Tobias Hofsäss
There were an estimated 10.4 million new cases of TB disease (also known as active TB) in 2015 and this included 1.2 million among HIV positive people. There were an estimated 3.5 million cases among women. There were also an estimated 1.0 million cases of TB in children and 170,000 children died of TB (excluding children with HIV).
TB incidence rates have fallen since 2000. However, the global rate of decline in the TB incidence rate was only 1.5% from 2014 to 2015 and the CFR (case fatality rate or case fatality ratio) in 2015 was 17%. The CFR is approximately the number of TB deaths divided by the TB incidence in the same year. It is conventionally expressed as a percentage and represents a measure of risk.3“Case fatality rate”, Wikipedia https://en.wikipedia.org/wiki/Case_fatality_rate
Estimates of the burden of TB disease in India have been revised upwards substantially by the World Health Organisation (WHO) for the period 2000 - 2015. This follows evidence from surveys and other means that the previous estimates of cases and deaths was too low. As the country with the highest burden of TB disease in the world, these revisions have had a major impact on the global estimates. The estimates for India are still though considered interim.
There were also in 2015 an estimated 480,000 new cases of multi drug resistant TB (MDR-TB) and an additional 100,000 people with rifampicin resistant TB (RR-TB). People with rifampicin resistant TB are now eligible for the same treatment as people with MDR TB. Drug resistant TB is now an increasing problem in the worldwide control of TB.
When the number of deaths becomes as large as 1.4 million, it can be hard to really understand what it means. So to further develop your understanding of what it is like, please read about dying of TB.
All countries are asked to report their TB figures to the WHO. WHO then use these notified figures to help produce estimated total TB statistics for each country, region, globally and by age. Globally it is thought that fewer than two-thirds (63%) of TB cases are notified. The WHO figures for the estimated incidence and number of deaths from TB in each WHO region are given below.
| Region | HIV negative TB Mortality | HIV positive TB Mortality | Total TB Incidence | HIV positive TB Incidence | Population |
|---|---|---|---|---|---|
| Africa | 450,000 | 300,000 | 2,720,000 | 834,000 | 989,000,000 |
| Americas | 19,000 | 5,900 | 268,000 | 32,000 | 991,000,000 |
| Eastern Mediterranean | 80,000 | 3,000 | 749,000 | 13,000 | 648,000,000 |
| Europe | 32,000 | 4,900 | 323,000 | 27,000 | 910,000,000 |
| South-East Asia | 710,000 | 74,000 | 4,740,000 | 227,000 | 1,930,000,000 |
| Western Pacific | 89,000 | 5,700 | 1,590,000 | 34,000 | 1,860,000,000 |
| Global Total | 1,400,000 | 390,000 | 10,400,000 | 1,170,000 | 7,320,000,000 |
People who had both TB and HIV infection at the time of their death, are internationally classified as having died of HIV. There is more information and statistics about HIV and TB co-infection.
| Region | Total TB Mortality | 0 - 14 years TB Mortality | Male >15 years | Female >15 years | Population |
|---|---|---|---|---|---|
| Africa | 743,000 | 97,500 | 416,000 | 230,000 | 989,000,000 |
| Americas | 24,390 | 2,370 | 15,570 | 6,490 | 991,000,000 |
| Eastern Mediterranean | 82,770 | 10,810 | 51,160 | 20,747 | 648,000,000 |
| Europe | 36,970 | 568 | 22,190 | 14,230 | 910,000,000 |
| South-East Asia | 786,300 | 90,000 | 496,500 | 199,600 | 1,930,000,000 |
| Western Pacific | 95,250 | 8,570 | 61,850 | 24,830 | 1,860,000,000 |
| Global Total | 1,769,000 | 210,000 | 1,062,000 | 496,000 | 7,320,000,000 |
It is estimated that in some developing countries up to ten percent of human tuberculosis is due to bovine TB.
Of all the countries that report their TB statistics to WHO, there are 22 countries that were referred to as the TB “high burden” countries. These countries had been prioritized at a global level since 2000. Between them they accounted for 83% of all estimated incident cases of TB worldwide in 2014. In addition to the main list there were two other lists, a list of high burden TB/HIV co-infection countries, and a third list of high burden MDR-TB countries.
In 2015 it was decided by WHO that the lists would be revised but that there would still be three lists. Each list would contain 30 countries. There is more about this on the TB “high burden” countries page.
The following is the estimated burden of TB for each of the 30 countries in the main high TB burden list.
| Country | HIV negative TB Mortality | HIV Positive TB Mortality | Total TB Incidence | HIV positive TB Incidence | Population |
|---|---|---|---|---|---|
| Angola | 11,000 | 7,200 | 93,000 | 28,000 | 25,000,000 |
| Bangladesh | 73,000 | 230 | 362,000 | 630 | 161,000,000 |
| Brazil | 5,500 | 2,200 | 84,000 | 13,000 | 208,000,000 |
| Cambodia | 8,600 | 440 | 59,000 | 1,400 | 15,600,000 |
| Central African Republic | 2,200 | 2,700 | 19,000 | 8,600 | 4,900,000 |
| China | 35,000 | 2,600 | 918,000 | 15,000 | 1,380,000,000 |
| Congo | 2,300 | 2,400 | 18,000 | 6,400 | 4,620,000 |
| DPR Korea | 15,000 | 40 | 141,000 | 450 | 25,200,000 |
| DP Congo | 51,000 | 16,000 | 250,000 | 39,000 | 77,300,000 |
| Ethiopia | 25,000 | 3,900 | 191,000 | 16,000 | 99,400,000 |
| India | 480,000 | 37,000 | 2,840,000 | 113,000 | 1,310,000,000 |
| Indonesia | 100,000 | 26,000 | 1,020,000 | 78,000 | 258,000,000 |
| Kenya | 9,000 | 7,200 | 107,000 | 36,000 | 46,100,000 |
| Lesotho | 1,200 | 4,800 | 17,000 | 12,000 | 2,140,000 |
| Liberia | 3,200 | 840 | 14,000 | 1,800 | 4,500,000 |
| Mozambique | 21,000 | 34,000 | 154,000 | 79,000 | 28,200,000 |
| Myanmar | 27,000 | 4,800 | 197,000 | 17,000 | 53,900,000 |
| Namibia | 780 | 880 | 12,000 | 4,900 | 2,460,000 |
| Nigeria | 180,000 | 57,000 | 586,000 | 100,000 | 182,000,000 |
| Pakistan | 44,000 | 1,600 | 510,000 | 8,800 | 189,000,000 |
| Papua New Guinea | 3,100 | 670 | 33,000 | 4,900 | 7,620,000 |
| Philippines | 14,000 | 440 | 324,000 | 4,300 | 101,000,000 |
| Russian Federation | 15,000 | 1,500 | 115,000 | 11,000 | 143,000,000 |
| Sierra Leone | 3,300 | 820 | 20,000 | 2,600 | 6,450,000 |
| South Africa | 25,000 | 73,000 | 454,000 | 258,000 | 54,500,000 |
| Thailand | 8,400 | 5,400 | 117,000 | 15,000 | 68,000,000 |
| UR Tanzania | 30,000 | 25,000 | 164,000 | 57,000 | 53,500,000 |
| Viet Nam | 16,000 | 1,100 | 128,000 | 5,500 | 93,400,000 |
| Zambia | 5,000 | 12,000 | 63,000 | 38,000 | 16,200,000 |
| Zimbabwe | 1,700 | 6,300 | 38,000 | 26,000 | 15,600,000 |
| Total for High Burden Countries | 1,200,000 | 340,000 | 9,050,000 | 1,000,000 | 4,630,000,000 |
There are more TB Statistics for India, TB Statistics for South Africa, TB Statistics for the United States and TB statistics for England.
or Tests for TB.
Global Tuberculosis Control 2016, WHO, Geneva, 2016 www.who.int/tb/publications/global_report/en/
| 1. | ↑ | “Basic Statistics: About Incidence, Prevalence, Morbidity, and Mortality - Statistics Teaching Tools”, Department of Health, New York State www.health.ny.gov/diseases/chronic/basicstat.htm |
| 2. | ↑ | “Fact Sheet - Latest Statistics on the Status of the AIDS Epidemic”,UNAIDS, www.unaids.org/en/resources/fact-sheet |
| 3. | ↑ | “Case fatality rate”, Wikipedia https://en.wikipedia.org/wiki/Case_fatality_rate |
Main Author : Annabel Kanabus
Citation : Kanabus, Annabel "Information about Tuberculosis", GHE, 2016, www.tbfacts.org
GHE is a registered charity (no. 1146692) based in the UK.
The initials GHE stand for Global Health Education.
GHE was set up as a charity to improve health through education, particularly in relation to diseases such as TB which have a global impact.