TB Statistics United States - National, drug resistance & state
National TB statistics United States 2016 & 2015
The preliminary TB statistics for the United States for 2016 show a total of 9,287 TB cases reported, compared with a total of 9,546 for 2,015. This is a very slight decline and a much higher rate of decline is needed if the goal of the elimination of TB in the United States is to be reached in the foreseeable future. This was a decrease in incidence from 3.0 per 100,000 to 2.0 per 100,000.
The incidence in 2016 ranged from 0.2 cases per 100,000 in Wyoming to 8.3 in Hawaii. Alaska, Arkansas, California, Florida, Georgia, Hawaii, Maryland, Minnesota, New Jersey, New York, North Dakota, and Texas, as well as Washington DC, all reported incidences that exceeded the overall national incidence. Four states, California (2,130), Texas (1,333), New York (763) and Florida (602) accounted for 50.9% of all cases.1“TB in the United States: Better, but still a long way to go”, May 1, 2017, AHC Media, https://www.ahcmedia.com/articles/140610-tb-in-the-united-states-better-but-still-a-long-way-to-go“ Among the individuals for whom the information was available, 5.7% were HIV infected, 4.6% had been homeless at some point in the previous year, 1.8% resided in a long term care facility and 3.5% were confined to a correctional facility.
Country of birth
Among the 9,287 cases of TB reported in 2016, 2,935 (31.6%) occurred among U.S. born people, and 6,307 (66.2%) TB cases were among foreign born people. So foreign born people in the United States continue to be disproportionately affected. The top five countries of origin of foreign born people with TB were Mexico, the Philippines, India, Vietnam and China. These five countries accounted for 54.9% of all cases among foreign born people.
TB cases for U.S. born people and foreign born people 2015
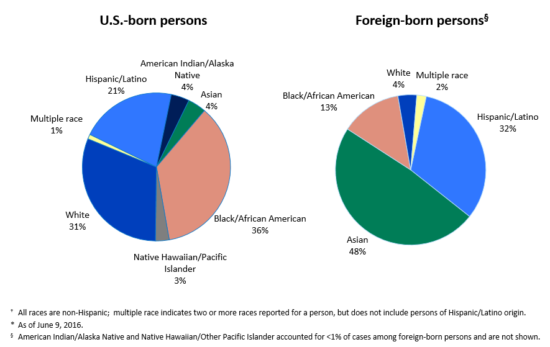
In 2015 of those people born in the U.S. 36% were Black/African American, 31% were White, and 21% Hispanic/Latino. Of those people who were foreign born 48% were Asian, 32% Hispanic/Latino and 13% Black/African American.
Drug resistance
The most recent year for which information about drug resistance, that is drug susceptibility data, is available is 2015. In 2015 there were 88 cases of multidrug resistant TB. Among the 88 cases 72 occurred in people with no reported history of TB disease. This means that they were cases of transmitted or primary drug resistant TB. One case of extensively drug-resistant TB was reported.
National no. of TB cases by year
In 2015 the number of U.S. TB cases increased compared with the previous year. This was the first time since 1992 that this had happened.
| 2015 | 2014 | 2013 | 2012 | 2011 | 2010 | 2009 | 2008 | 2007 | |
|---|---|---|---|---|---|---|---|---|---|
| No. of TB cases | 9,557 | 9,406 | 9,550 | 9,942 | 10,510 | 11,159 | 11,520 | 12,893 | 13,282 |
| Rate per 100,000 population | 3.0 | 2.9 | 3.0 | 3.2 | 3.4 | 3.6 | 3.8 | 4.2 | 4.4 |
| Deaths | Not known | 493 | 555 | 510 | 539 | 569 | 529 | 585 | 554 |
| Rate per 100,000 population | Not known | 0.2 | 0.2 | 0.2 | 0.2 | 0.2 | 0.2 | 0.2 | 0.2 |
These figures are very different to those of the 1950s which are shown below. This is when the statistics for TB first started to be collected. The decrease in both the number of cases and deaths, is not only due to improved TB control, but also to the development of TB drugs.
| 1961 | 1960 | 1959 | 1958 | 1957 | 1956 | 1955 | 1954 | 1953 | |
|---|---|---|---|---|---|---|---|---|---|
| No. of TB cases | 53,726 | 55,494 | 57,535 | 63,534 | 67,149 | 69,895 | 77,368 | 79,775 | 84,304 |
| Rate per 100,000 population | 29.2 | 30.7 | 32.4 | 36.3 | 39.0 | 41.4 | 46.6 | 48.9 | 52.6 |
| Deaths | 9,938 | 10,866 | 11,474 | 12,417 | 13,390 | 14,137 | 15,016 | 16,527 | 19,707 |
| Rate per 100,000 population | Not known | 6.0 | 6.5 | 7.1 | 7.8 | 8.4 | 9.1 | 10.2 | 12.4 |
TB statistics United States by state

TB Statistics United States cases per 100,000 2015
Cases of TB for each state in 2015, 2014 & 2013 & number of U.S. born people & foreign born people for 2015
| State | Population | Cases 2015 | Cases 2014 | Cases 2013 | No. of U.S. born people 2015 |
No. of foreign born people 2015 |
|---|---|---|---|---|---|---|
| Alabama | 4,858,979 | 119 | 133 | 108 | 90 | 29 |
| Alaska | 738,432 | 68 | 62 | 71 | 55 | 8 |
| Arizona | 6,828,065 | 198 | 193 | 184 | 57 | 141 |
| Arkansas | 2,978,204 | 90 | 93 | 72 | 72 | 18 |
| California | 39,144,818 | 2,133 | 2,134 | 2,166 | 406 | 1,718 |
| Colorado | 5,456,574 | 73 | 64 | 74 | 15 | 58 |
| Connecticut | 3,590,886 | 70 | 60 | 62 | 13 | 57 |
| Delaware | 945,934 | 22 | 22 | 19 | 8 | 13 |
| District of Columbia | 672,228 | 33 | 32 | 37 | 15 | 18 |
| Florida | 20,271,272 | 602 | 595 | 651 | 260 | 342 |
| Georgia | 10,214,860 | 324 | 335 | 338 | 176 | 148 |
| Hawaii | 1,431,603 | 127 | 136 | 115 | 45 | 82 |
| Idaho | 1,654,930 | 11 | 11 | 11 | 1 | 9 |
| Illinois | 12,859,995 | 343 | 320 | 327 | 100 | 243 |
| Indiana | 6,619,680 | 116 | 108 | 94 | 49 | 67 |
| Iowa | 3,123,899 | 38 | 54 | 47 | 7 | 31 |
| Kansas | 2,911,641 | 36 | 40 | 36 | 10 | 26 |
| Kentucky | 4,425,092 | 67 | 80 | 59 | 34 | 33 |
| Louisiana | 4,670,724 | 119 | 121 | 139 | 80 | 39 |
| Maine | 1,329,328 | 18 | 14 | 15 | 4 | 14 |
| Maryland | 6,006,401 | 176 | 198 | 175 | 42 | 134 |
| Massachusetts | 6,794,422 | 192 | 199 | 201 | 25 | 163 |
| Michigan | 9,922,576 | 131 | 105 | 141 | 47 | 84 |
| Minnesota | 5,489,594 | 150 | 147 | 151 | 22 | 128 |
| Mississippi | 2,992,333 | 74 | 74 | 65 | 64 | 10 |
| Missouri | 6,083,672 | 92 | 79 | 104 | 37 | 55 |
| Montana | 1,032,949 | 9 | 6 | 6 | 7 | 2 |
| Nebraska | 1,896,190 | 33 | 38 | 21 | 8 | 25 |
| Nevada | 2,890,845 | 85 | 74 | 92 | 26 | 59 |
| New Hampshire | 1,330,608 | 13 | 11 | 15 | 2 | 11 |
| New Jersey | 8,958,013 | 326 | 308 | 320 | 61 | 265 |
| New Mexico | 2,085,109 | 47 | 50 | 50 | 23 | 24 |
| New York | 19,795,791 | 765 | 787 | 865 | 148 | 616 |
| North Carolina | 10,042,802 | 199 | 195 | 216 | 107 | 92 |
| North Dakota | 756,927 | 9 | 15 | 12 | 1 | 8 |
| Ohio | 11,613,423 | 143 | 156 | 148 | 54 | 89 |
| Oklahoma | 3,911,338 | 67 | 59 | 70 | 42 | 25 |
| Oregon | 4,028,977 | 76 | 77 | 73 | 24 | 52 |
| Pennsylvania | 12,802,503 | 200 | 209 | 214 | 79 | 121 |
| Rhode Island | 1,056,298 | 30 | 21 | 27 | 4 | 26 |
| South Carolina | 4,896,146 | 104 | 79 | 112 | 79 | 25 |
| South Dakota | 858,469 | 17 | 8 | 9 | 12 | 5 |
| Tennessee | 6,600,299 | 131 | 151 | 143 | 72 | 59 |
| Texas | 27,469,114 | 1,334 | 1,269 | 1,222 | 570 | 764 |
| Utah | 2,995,919 | 37 | 31 | 33 | 9 | 28 |
| Vermont | 626,042 | 7 | 2 | 5 | 3 | 4 |
| Virginia | 8,382,993 | 212 | 198 | 179 | 44 | 168 |
| Washington | 7,170,351 | 208 | 195 | 209 | 48 | 160 |
| West Virginia | 1,844,128 | 13 | 13 | 13 | 7 | 3 |
| Wisconsin | 5,771,337 | 69 | 47 | 49 | 20 | 49 |
| Wyoming | 586,107 | 4 | 2 | 0 | 2 | 2 |
Comment
Would you like to send us a comment about this page?
You can read more about:
Major Source for TB statistics United States
Reported Tuberculosis in the United States 2015, Centers for Disease Control and Prevention, Atlanta, 2015 www.cdc.gov/tb/statistics/reports/2015/default.htm
References
| 1. | ↑ | “TB in the United States: Better, but still a long way to go”, May 1, 2017, AHC Media, https://www.ahcmedia.com/articles/140610-tb-in-the-united-states-better-but-still-a-long-way-to-go“ |